Dashboard
Campaign Manager Dashboard
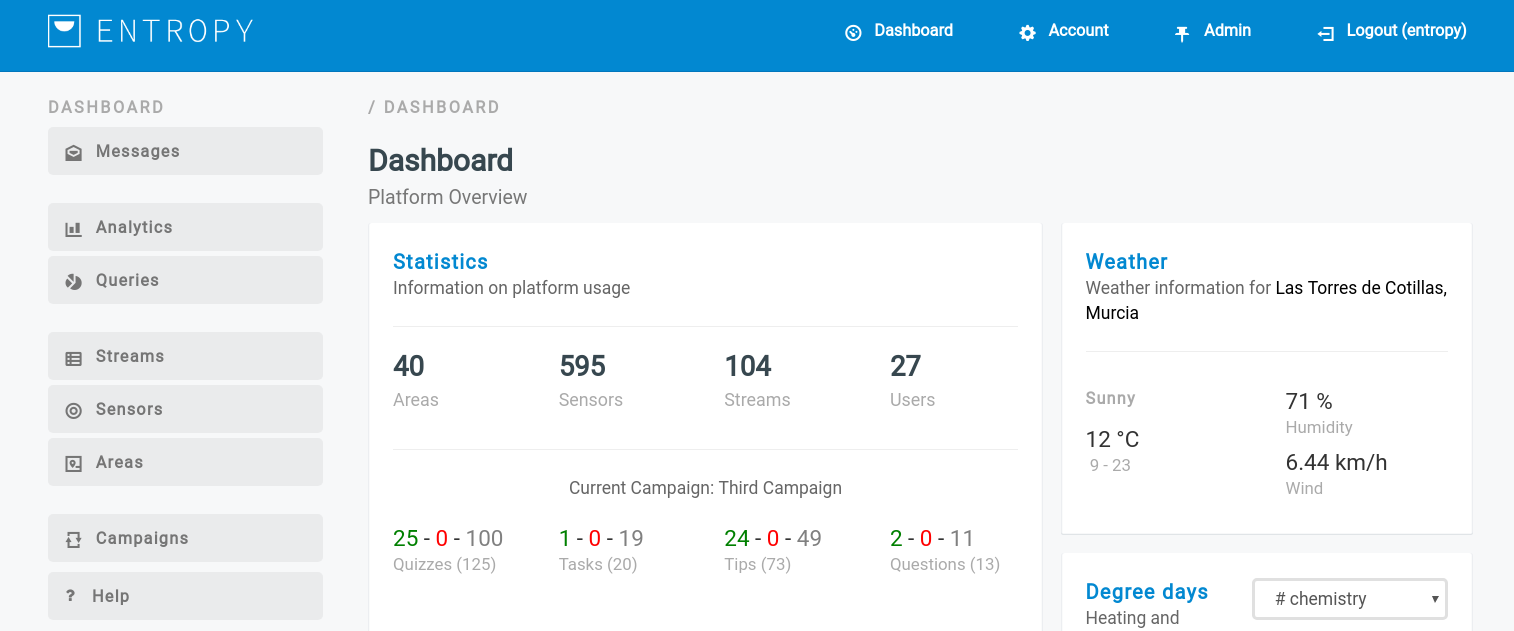
- Initially the user must login using the Campaign manager Credentials.
- Click on Dashboard button to review it.
- Dashboard includes sever information such as an overall view of registered sensors, areas , streams etc, local weather conditions, connected consumption apps.
- In case there is an active campaign, Dashboard also informs about the responsiveness of the users to the generated recommendations.
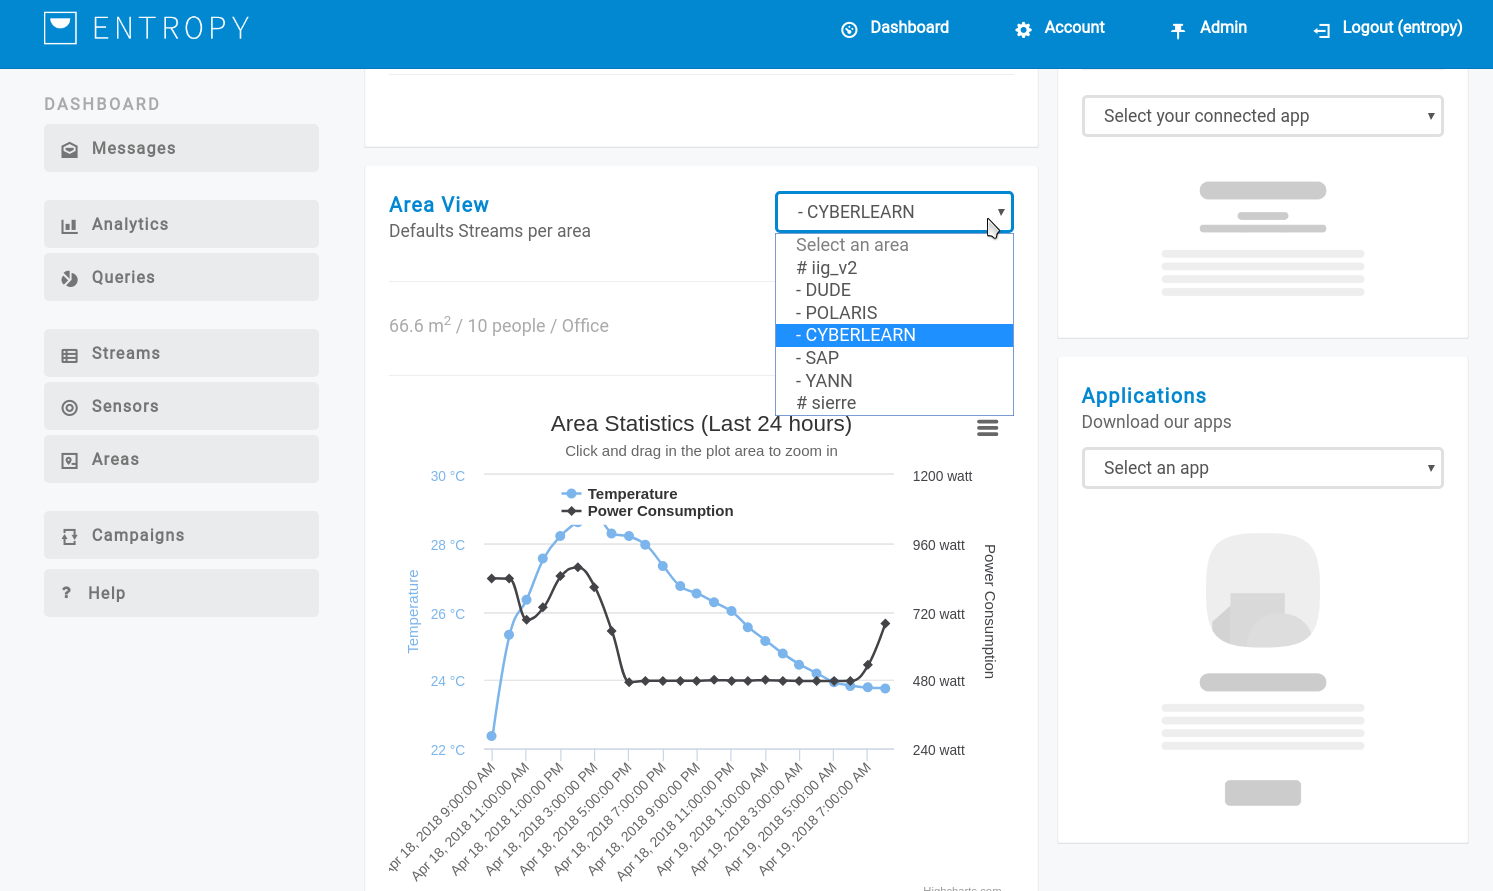
- Within a dropdown menu the Admin or Campaign manager can see some area statistics for the last 25 hours regarding the temperature and consuption of each registered building/area.
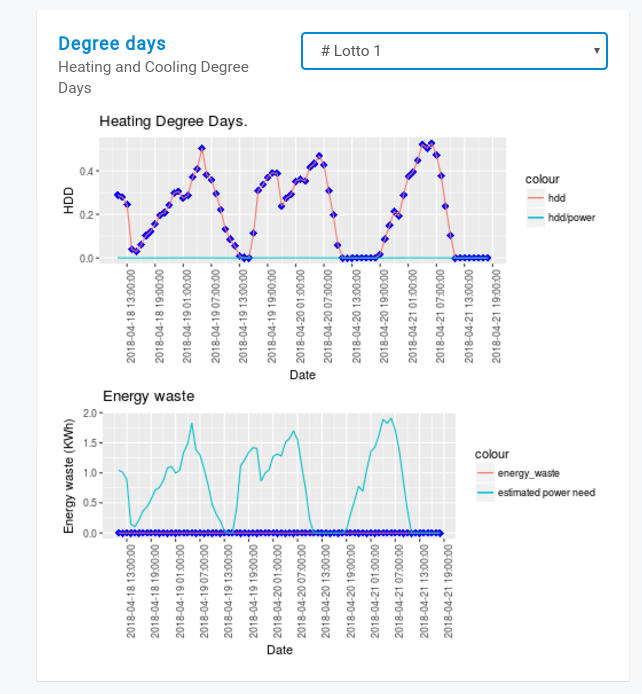
- Within a dropdown menu the Admin or Campaign manager can see the cooling/heating degree days as well as the relevant energy waste per area.
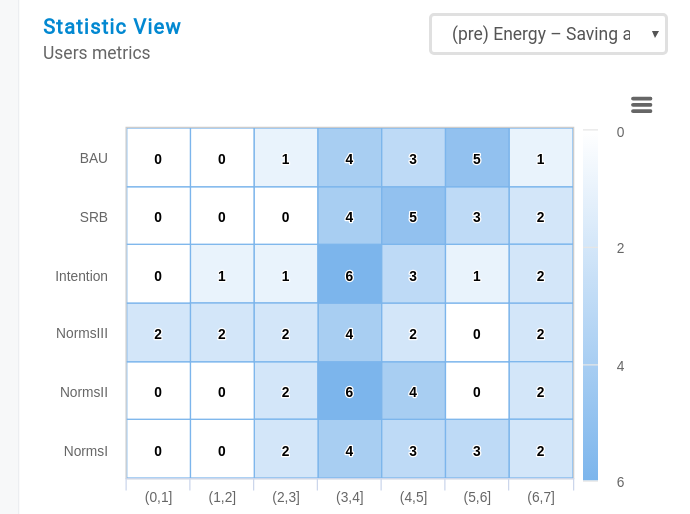
Also can see the behavioural profile of the registered Users. To see the behavioural change has to compare the behavioural heatmaps hosted at the campaigns menu part.
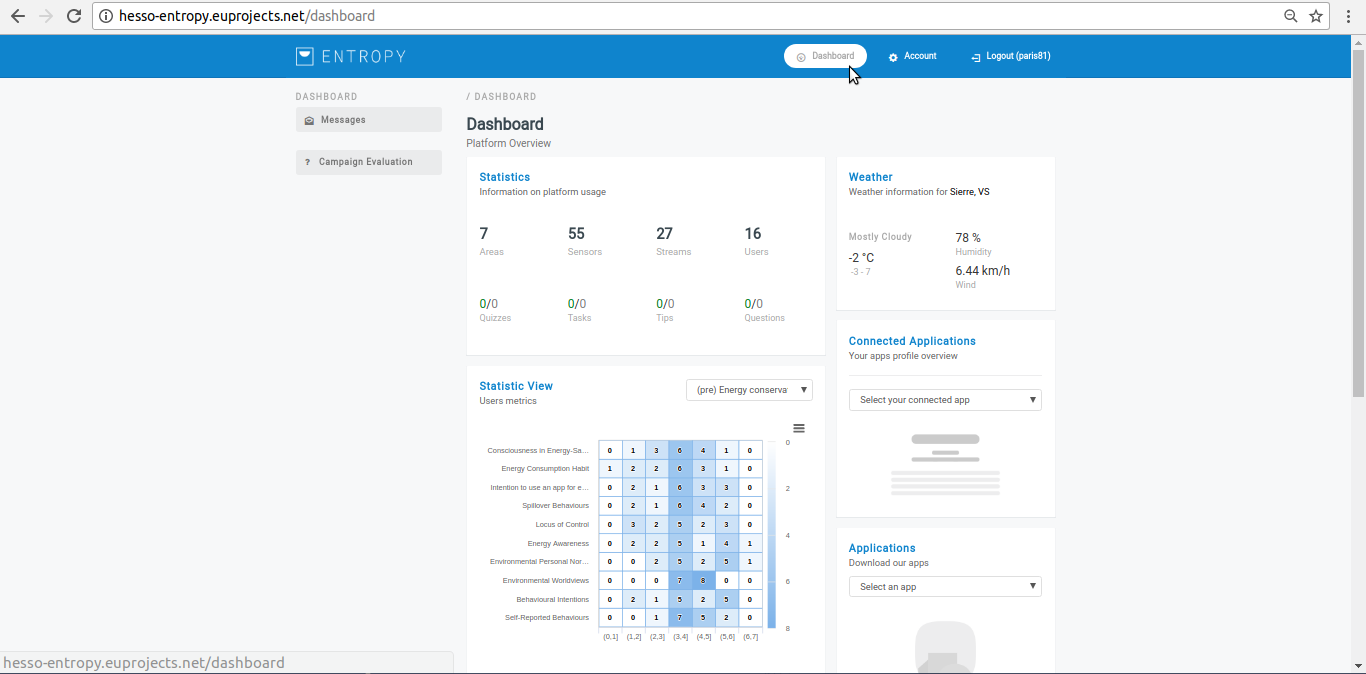
End User Dashboard
- Initially the user must login using the End User Credentials.
- Click on Dashboard button to review it. The End User has limited access (messages, campaign evaluation)